
The downward pressure on global stock prices has been relentless again in February, yet I continue to maintain that in terms of the bigger picture bull market there is still no decisive technical damage. This is what I see in my bigger picture chart…
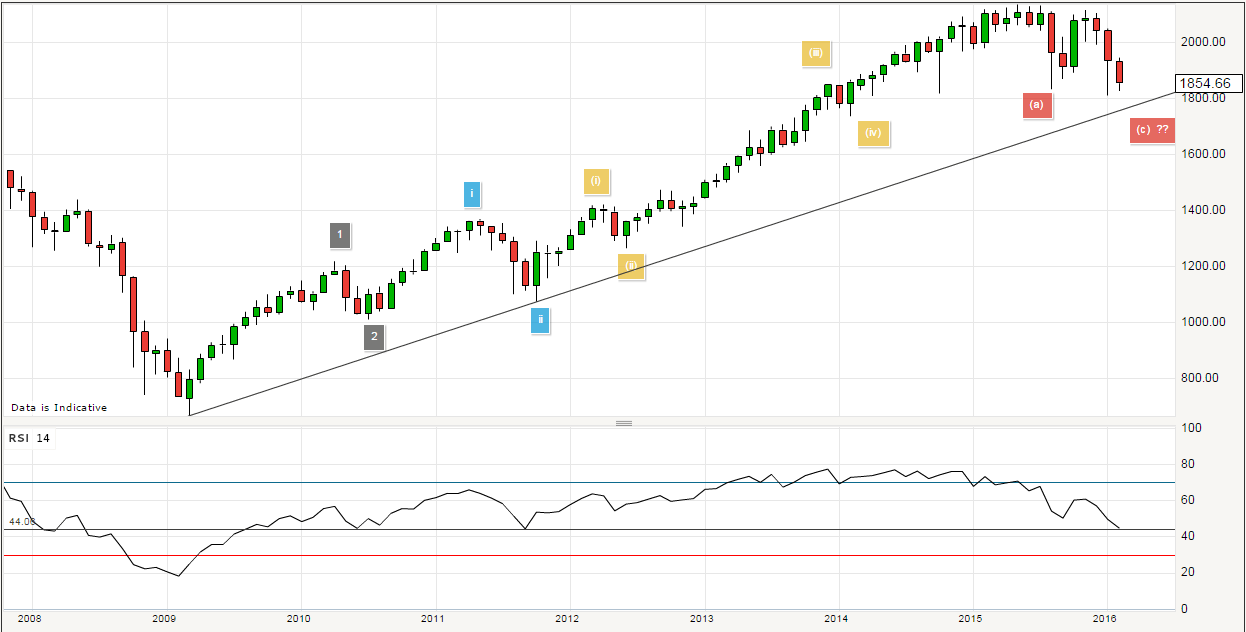
You’ll note that the trend-line going back to 2009 remains intact, and indeed we have some ways to go before going below that line. As far as I’m concerned, even if we were to breach the trend line we would need to see the S&P index (above) fall below 1400, another 25% lower, before we could call an end to the post Global Financial Crisis rally. Despite my conviction it is clear that we are experiencing one of the most severe bouts of sustained negative bouts of risk sentiment since the depths of panic in 2009. You only have to look at how gold has rallied since the start of the year, or how much government bonds have rallied to appreciate that a substantial flight to quality is underway. Japanese 10 year government bond yields have now tumbled to zero, the first mid to long bond yields of a G7 nation to do so., a sign of market caution if there ever was one. I have noted one chart which might cause the Federal Reserve to proceed with some caution from where we are now…

This is the spread (the difference) between US 2 year Treasury bond yields and 10 year bond yields. The last time this spread went into negative territory preceded the Global Financial Crisis, and it is one of the best measures used to assess the tightness of US monetary policy. The Federal Reserve will not want to see this chart go much lower than it is, even though it is some distance away from negative territory, I don’t believe US policy makers are anywhere near the sort of conviction levels about US economic strength that a flatter yield curve implies. For now we hover around what has become a fairly significant support zone over the last 8 years so it is worth keeping a close eye on this spread. It’s hard to say what this all means for currencies, or more specifically, what it means for the US dollar. Typically a flattening yield curve is synonymous with a strengthening currency which is exactly what we’ve seen as the yield curve has tightened. I suspect that it will be tough for a continuation of broad based dollar appreciation from here. But let’s be clear, the dollar has actually weakened against some of its major rivals (EUR & JPY) so far this year. Emerging market currencies and the pound sterling continue to feel the pressure against the dollar but this has more to do with their idiosyncratic issues than actual dollar strength.
The former central bank governor of Nigeria recently made comments about naira policy, and he is spot on. “Unfortunately, because the exchange rate is right out there in front now, monetary policy is being seen as the barometer for broader economic thinking. It is sad that on this one policy you get it so wrong that you risk taking away attention from everything else you are doing.” Couldn’t have said it better.
DISCLAIMER
Any financial promotion contained herein has been issued and approved by ParityFX Plc (“ParityFX”); a firm authorised and regulated by the Financial Conduct Authority (“FCA”) as a Payment Services Institution with registration number 606416. It is for informational purposes and is not an official confirmation of terms. It is not guaranteed as to accuracy, nor is it a complete statement of the financial products or markets referred to.
Opinions expressed are subject to change without notice and may differ or be contrary to the opinions or recommendations of ParityFX. Unless stated specifically otherwise, this is not a recommendation, offer or solicitation to buy or sell and any prices or quotations contained herein are indicative only. To the extent permitted by law, ParityFX does not accept any liability arising from the use of this communication.
Follow our tweets @parityfxplc
Follow us on LinkedIn ParityFX Plc