| High | Low | High | Low | |||
| EUR/USD | 1.1020 | 1.0957 | USD/ZAR | 11.9277 | 11.8357 | |
| GBP/USD | 1.4944 | 1.4872 | GBP/ZAR | 17.77 | 17.61 | |
| EUR/GBP | 0.7385 | 0.7365 | USD/RUB | 57.64 | 55.85 | |
| USD/JPY | 119.58 | 118.48 | USD/NGN | 199.8 | 199.0 | |
| GBP/CHF | 1.4298 | 1.4235 | S&P 500 | 2,065 | 2,049 | |
| USD/ILS | 3.9677 | 3.8963 | Oil (Brent) | 59.80 | 56.18 | |
Candlesticks are an ancient Japanese visual tool for conducting technical analysis of prices. If I have my history correct, it was initially developed for the rice markets. I find the methodology very useful, as it enables market technicians to quickly assess the price action over a given period, by illustrating a visual representation of opening prices, closing prices and the high and low prices for a given period. It is thus easy to look at a chart and see that prices opened near highs made significant new lows but then closed again near the highs. If I seem to be talking gibberish my apologies, but there’s a point to be made. When you look at the monthly chart for EUR/USD going back 15 years using Japanese candlesticks it is noticeable that at significant market lows there is evidence of strong buying pressure before major reversals. This is what we see at the moment for EUR/USD, and even though the month is not yet over, as things stand there is a substantial risk that we have made a significant low in EUR/USD this month. Please see the chart below…
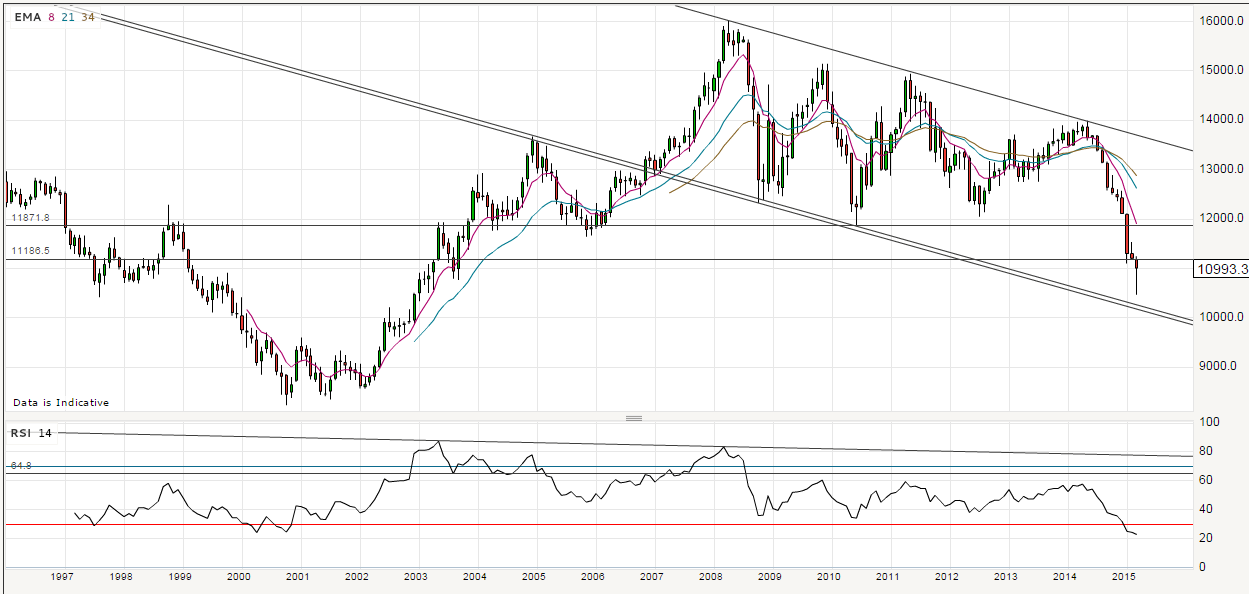
And here is an excerpt of some commentary I made regarding the chart to a colleague yesterday…
“Looking at the monthly chart for EUR/USD, it’s clear that if we end the month, around current levels or even a bit higher the potential exists for an even larger reversal than has already happened. The current monthly candle stick looks very much like a hammer formation, albeit I prefer the body to be a bit smaller (hence a higher EUR/USD ~1.11). Whatever the case, the amount of buying from the lows – if this were month-end right here – has been substantially more than at the lows of 2008, 2010 and 2012, and based on the RSI we are at far more oversold levels now than at any of those prior periods. Even if we don’t believe that we get the sort of sustained bullish move that has tended to follow such reversal signals in the past, it would not be unreasonable for the currency pair to get up to the fastest of the moving averages in the chart below. That implies a move back to the 1.19 – 20 zone. I’m not sure people are prepared for that and furthermore I’m not sure what the implications are of a reversal in the dollar move of that magnitude but it should have a serious impact on global macro…
Finally.. even if we don’t get a substantial reversal from here, the level of the RSI implies to me that we will get a sustained period of trendless price action as the RSI works its way from current extremes. Worth thinking about!”
I’ve attached it to today’s blog to give you as clear a sense of my thinking as I possibly can. But please let me be clear.. I don’t believe the dollar bull-trend is over, but we may be in for a period of counter-trend reversal. This doesn’t not mean that we, at ParityFX, don’t still believe that EUR/USD parity is no longer possible this year, but the path to that target may become much more complicated… and volatile.
Tensions in the Middle East with Saudi Arabia launching air strikes against rebels in Yemen have given oil prices a huge boost today with Brent crude up 5% this morning. And out of the woodwork we hear of anti-consensus ‘oil to $100’ trades being put on by traders (according to the Financial Times). There is macro risk out there in a way it hasn’t been for some years. In Europe we have stock markets surging to new highs; sentiment and manufacturing data suggesting the Eurozone is turning the corner; robust employment in the United States; a Federal Reserve that is just itching to raise rates; data that looks far less positive coming out of China. We have the whole works!
If the candlesticks read right and we get a bounce higher in EUR/USD, the Federal Reserve will no longer feel as concerned about dollar strength as they currently are. There will be nothing to stop an interest rate hike then. Sometimes you focus on one things and something else slaps you in the face. You have been warned…
DISCLAIMER
Any financial promotion contained herein has been issued and approved by ParityFX Plc (“ParityFX”); a firm authorised and regulated by the Financial Conduct Authority (“FCA”) as a Payment Services Institution with registration number 606416. It is for informational purposes and is not an official confirmation of terms. It is not guaranteed as to accuracy, nor is it a complete statement of the financial products or markets referred to.
Opinions expressed are subject to change without notice and may differ or be contrary to the opinions or recommendations of ParityFX. Unless stated specifically otherwise, this is not a recommendation, offer or solicitation to buy or sell and any prices or quotations contained herein are indicative only. To the extent permitted by law, ParityFX does not accept any liability arising from the use of this communication.
Follow our tweets @parityfxplc
Follow us on LinkedIn ParityFX Plc
Good job..great posting